Population Pyramids
- Each age cohort expressed as a of total population.
- Grouped by sex.
- Allows us to see:
- Analysis:
- Look at the shape of the pyramid
- Size, shape
- Centre sizing
- Variations in sex and age groups
- Changes in shape
- Future consequences as well.
-
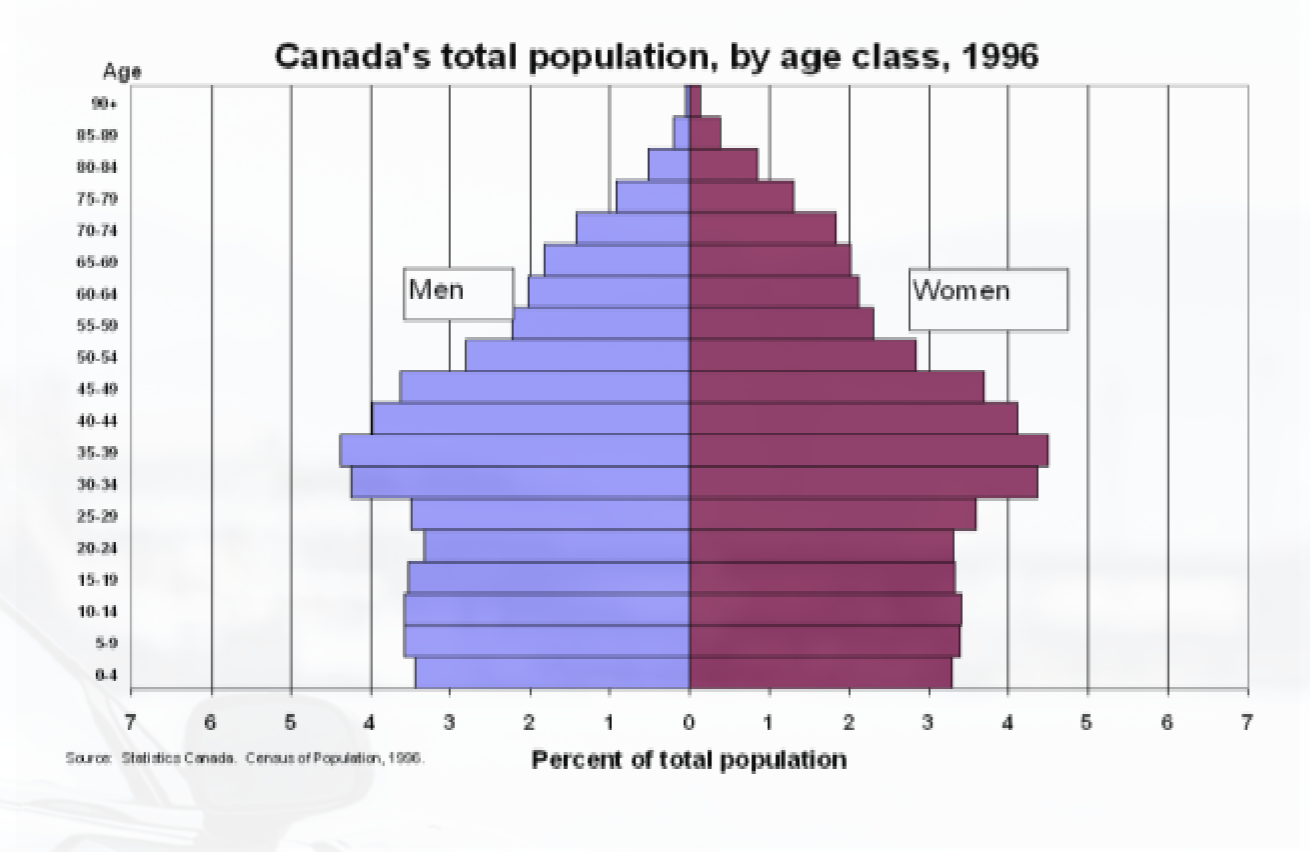
- You can see that the lower part hasn't had much variance. So fertility has remained stagnant.
- Demographic Momentum from the higher age cohorts is carrying onto the newer generations.
- Dependency Ratio can be see here as well. When the 30 - 55 age group gets older, the younger population may not be able to support them.
- Echo effect is because the baby boom, when they get older will have more children resulting in that demographic momentum effect.
- Seeing the Population Pyramids over time can show you how much change can happen so quickly.